2.3.3. Drawing
- teaspoon.TDA.Draw.drawDgm(D, boundary=None, epsilon=0.5, color=None)[source]
Draws simple persistence diagram plot
- Parameters:
D – a persistence diagram, given as a Nx2 numpy array
boundary – Boundary of persistence diagram axes
epsilon – The diagram is drawn on [0,boundary]x[0,boundary]. If boundary not given, then it is determined to be the max death time from the input diagram plus epsilon.
- Returns:
Figure that includes persistence diagram
- teaspoon.TDA.Draw.drawPtCloud(P)[source]
Draws simple point cloud plot
- Parameters:
P – a point cloud, given as a NxD numpy array. Even if D>2, only the first two coordinates are plotted.
2.3.3.1. Examples
The following example plots a persistence diagram:
from ripser import ripser
from teaspoon.TDA.Draw import drawDgm
from teaspoon.MakeData.PointCloud import Torus

numPts = 500
seed = 0

# Generate Torus
t = Torus(N=numPts,seed = seed)

# Compute persistence diagrams
PD1 = ripser(t,2)['dgms'][1]

# Plot the diagram
drawDgm(PD1)
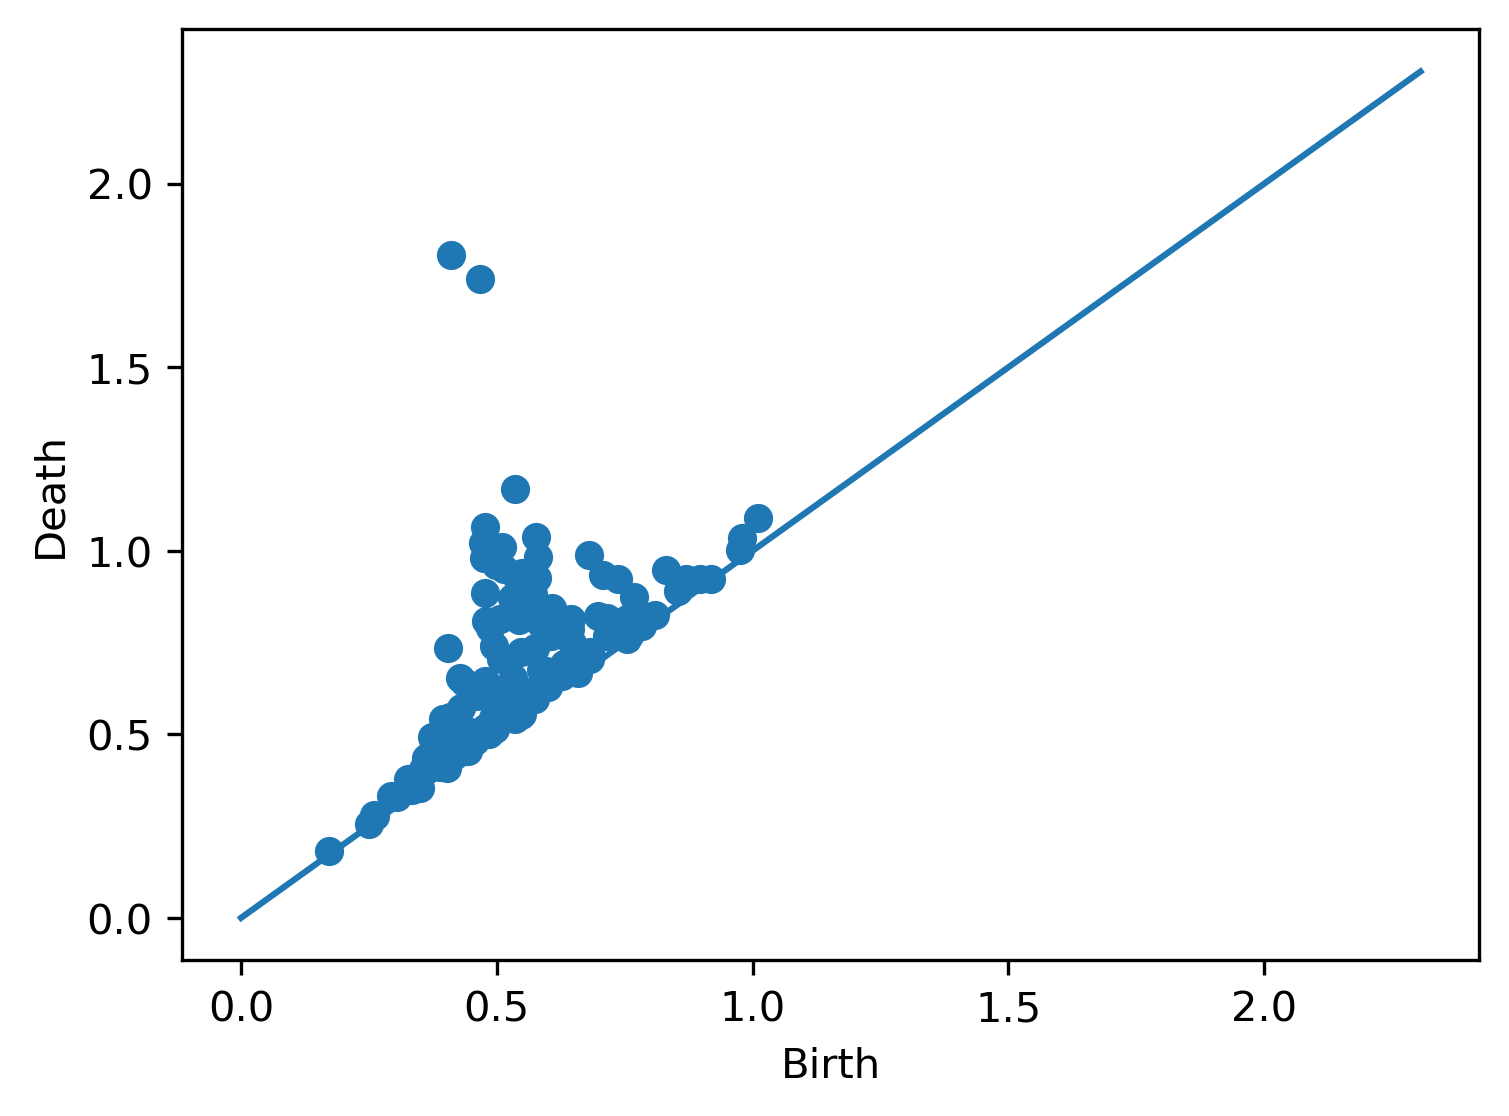
The output for this example is
The following example plots a point cloud:
from ripser import ripser
from teaspoon.TDA.Draw import drawPtCloud
from teaspoon.MakeData.PointCloud import Torus

numPts = 500
seed = 0

# Generate Torus
T = Torus(N=numPts,seed = seed)

# Plot the point cloud
drawPtCloud(T)
The output for this example is
