2.5.1. Point Cloud Data Generation Module Documentation
This module is used to generate point cloud data sampled from various underlying shapes. Specifically, the possible shapes are:
Annulus
Circle
Clusters
Cube
Sphere
Torus
Gaussians
Sinc
2D Gaussian Field
Additionally, this module can also generate random persistence diagrams.
- teaspoon.MakeData.PointCloud.Annulus(N=200, r=1, R=2, seed=None)[source]
Returns point cloud sampled from uniform distribution on annulus in \(\mathbb{R}^2\) of inner radius r and outer radius R
- Parameters:
N – Number of points to generate
r – Inner radius of the annulus
R – Outer radius of the annulus
seed – Fixes the seed. Good if we want to replicate results.
- Returns:
P - An \(N \times 2\) numpy array with one point per row.
- teaspoon.MakeData.PointCloud.Circle(N=100, r=1, gamma=None, seed=None)[source]
Generate \(N\) points in \(\mathbb{R}^2\) from the circle centered at the origin with radius \(r\).
If gamma is not None, then we add noise using a normal distribution. Note that this means the resulting distribution is not bounded, so your favorite stability theorem doesn’t immediately apply.
- Parameters:
N – Number of points to generate
r – Radius of the circle
gamma – Standard deviation of the normally distributed noise.
seed – Fixes the seed. Good if we want to replicate results.
- Returns:
P- An \(N \times 3\) numpy array with a point per row.
- teaspoon.MakeData.PointCloud.Clusters(N=100, centers=array([[0, 0], [3, 3]]), sd=1, seed=None)[source]
Generate k clusters of points in \(\mathbb{R}^d\), N points in total, approximately evenly divided. The centers are given as a \(k \times d\) numpy array, where centers[i,:] is the center of the ith cluster in \(\mathbb{R}^d\). Points are drawn from a normal distribution all with the same standard deviation sd.
- Parameters:
N – Number of points to be generated
centers – \(k \times d\) numpy array, where centers[i,:] is the center of the ith cluster in \(\mathbb{R}^d\).
sd – Standard deviation of clusters.
seed – Fixed value for the seed, or None.
- Returns:
P - An \(N \times d\) numpy array with a point per row.
- teaspoon.MakeData.PointCloud.Cube(N=100, diam=1, dim=2, seed=None)[source]
Generate N points in \(\mathbb{R}^{dim}\) from the box \([0,diam]\times[0,diam]\times ...\times [0,diam]\)
- Parameters:
N – Number of points to generate
diam – Points are pulled from the box \([0,diam]^{dim}\)
dim – Points are embedded in \(\mathbb{R}^{dim}\)
- Returns:
P - An \(N \times dim\) numpy array with a point per row.
- teaspoon.MakeData.PointCloud.GaussianField(m, n, a=0.8, b=100)[source]
Returns matrix representing the 2D gaussian field made on an m x n grid
- Parameters:
m – Integer for length of grid in x
n – Integer for length of grid in y
a – Smoothness of the gaussian field: Positive real number less than 1.0
b – Spatial scaling parameter: Positive real number
- Returns:
- Z
A 2D numpy array
- teaspoon.MakeData.PointCloud.Gaussians(centers, variances, amplitudes=None, resolution=200)[source]
Returns matrix representing the 2D gaussians made with given centers, variances and amplitudes
- Parameters:
centers – Numpy array of lists as [center x, center y] for each required peak
variances – Numpy array of variances for each required peak
amplitudes – Numpy array of amplitudes for each peak. If length is less than provided centers/variances, amplitude will be considered 1.0
resolution – Number of points used to generate meshgrid in both x and y
- Returns:
- Z
A 2D numpy array
- teaspoon.MakeData.PointCloud.Sinc(x1=-10, x2=10, y1=-10, y2=10, N1=1000, N2=1000, mu=0, sigma=0.01, seed=None)[source]
Returns matrix representing the 2D sinc function on grid made on x1, x2, y1, y2 of N1 and N2 length
- Parameters:
x1 – Left x boundary
x2 – Right x boundary
y1 – Left y boundary
y2 – Right y boundary
N1 – Discretization of x
N2 – Discretization of y
mu – Mean of normal noise added
sigma – Variance of normal noise added
- Returns:
- f
A numpy array with shape (N1, N2)
- teaspoon.MakeData.PointCloud.Sphere(N=100, r=1, noise=0, seed=None)[source]
Generate \(N\) points in \(\mathbb{R}^3\) from the sphere centered at the origin with radius \(r\). If noise is set to a positive number, the points can be at distance \(r \pm\) noise from the origin.
- Parameters:
N – Number of points to generate
r – Radius of the sphere
seed – Value for seed, or None.
- Returns:
P- An \(N \times 3\) numpy array with a point per row.
- teaspoon.MakeData.PointCloud.Torus(N=100, r=1, R=2, seed=None)[source]
Sampling method taken from Sampling from a Manifold by Diaconis, Holmes and Shahshahani, arXiv:1206.6913.
Generates torus with points
\[x = ( R + r \cos(\theta) ) \cos(\psi),\]\[y = ( R + r\cos(\theta) ) \sin(\psi),\]\[z = r \sin(\theta)\]Need to draw \(\theta\) with distribution
\[g(\theta) = (1+ r \cos(\theta)/R ) / (2\pi)\]on \(0 \leq \theta < 2\pi\), and \(\psi\) with uniform density on \([0,2\pi)\). Draw \(\theta\) uniformly from \([0,2\pi)\) and \(\eta\) from \([1-r/R,1+r/R]\). If \(\eta< 1 + (r/R) \cos(\theta)\), return \(\theta\).
- Parameters:
N – Number of points to generate
r – Inner radius of the torus
R – Outer radius of the torus
seed – Value for seed, or None.
- Returns:
P - An \(N \times 3\) numpy array with one point per row.
- teaspoon.MakeData.PointCloud.normalDiagram(N=20, mu=(2, 4), sd=1, seed=None)[source]
Generates a diagram with points drawn from a normal distribution in the persistence diagram plane. Pulls N points from a normal distribution with mean mu and standard deviation sd, then discards any points that are below the diagonal. Note, however, that this does not get rid of negative birth times.
- Parameters:
N – Original number of points drawn for the persistence diagram.
mu – Mean and standard deviation of the normal distribution used to generate the points.
sd – Mean and standard deviation of the normal distribution used to generate the points.
seed – Used to fix the seed if passed an integer; otherwise should be None.
- Returns:
A persistence diagram given as a numpy array of size \(K \times 2\).
- teaspoon.MakeData.PointCloud.testSetClassification(N=20, numDgms=(10, 10), muRed=(1, 3), muBlue=(2, 5), sd=1, permute=True, seed=None)[source]
Generate a collection of diagrams using the normalDiagram() function for classification tests.
- Parameters:
N – The number of initial diagrams pulled to create each diagram. Diagrams could end up with fewer than N pts as the pts drawn below the diagonal will be discarded. See normalDiagram() for more information.
numDgms – The number of diagrams for the collection. Can either be an integer, in which case numDgms is the number of diagrams of each type that are generated, thus returning a data set with 2*numDgms diagrams. Alternatively, numDgms can be passed as a length two list (n,m) where n diagrams of the first type and m diagrams of the second type are drawn, for a total of n+m diagrams.
muRed – The means used for the normal distribution in normalDiagram() for the two different types.
muBlue – The means used for the normal distribution in normalDiagram() for the two different types.
sd – The standard deviation for the normal distribution used for normalDiagram().
permute – If
permute=True, the data frame returned has its rows randomly permuted. If False, the rows will be red type followed by blue type.seed – Used to fix the seed if passed an integer; otherwise should be None.
- Returns:
A pandas dataframe with columns
['Dgm', 'mean', 'sd', 'trainingLabel']. In this case, the entry in trainingLabel is -1 if the diagram was drawn from the red type, and 1 if drawn from the blue type.
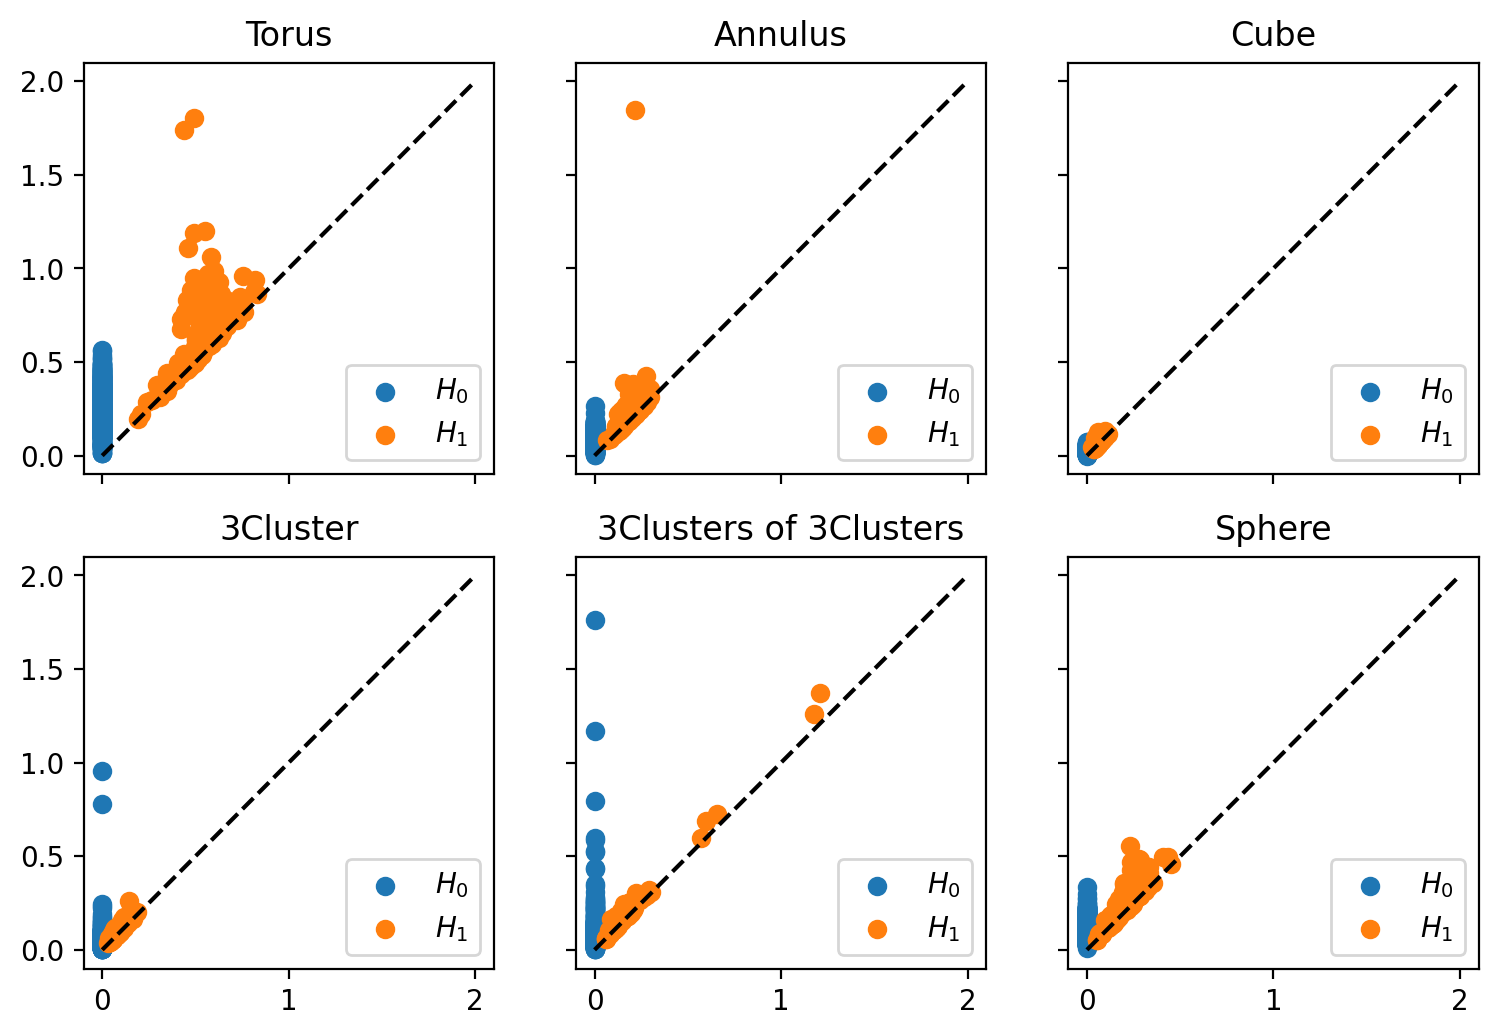
- teaspoon.MakeData.PointCloud.testSetManifolds(numDgms=50, numPts=300, permute=True, seed=None, verbose=False)[source]
Generates a collection of diagrams from different underlying topological spaces. This set is useful for testing classification tasks.
- The types of underlying spaces with their entry in the trainingLabel column is as follows. Each function uses the default values (except for the number of points) unless otherwise noted.
Torus: A torus embedded in \(\mathbb{R}^3\) using the function Torus().
Annulus: An annulus generated with default inputs of Annulus().
Cube: Points drawn uniformly from the cube \([0,1]^3 \subset \mathbb{R}^3\) using the function Cube().
3Cluster: Points are drawn using Clusters() with centers [0,0], [0,1.5], [1.5,0] with sd = 0.05.
3Clusters of 3Clusters: Points are drawn with 9 different centers, which can be loosely grouped into three groups of three; again uses Clusters() with sd = 0.05. The centers are [0,0], [0,1.5], [1.5,0]; this set rotated 45 degrees and shifted up by 4; and the first set shifted right 3 and up 4.
Sphere: Points drawn from a sphere using Sphere() with noise = .05.
- Parameters:
numDgms – The number of diagrams generated of each type. The resulting dataset will have 6*numDgms diagrams.
numPts – The number of points in each point cloud.
permute – If
permute=True, the data frame returned has its rows randomly permuted. If False, the rows will be red type followed by blue type.seed – Used to fix the seed if passed an integer; otherwise should be None.
- Returns:
A pandas DataFrame with columns
['Dgm0', 'Dgm1', 'trainingLabel']. The trainingLabel row has entries with labels given as the boldface above.
- teaspoon.MakeData.PointCloud.testSetRegressionBall(N=20, numDgms=40, muCenter=(1, 3), sd=1, permute=True, seed=None)[source]
Generate a collection of diagrams with means distributed normally using the normalDiagram() function; used for regression tests.
- Parameters:
N – The number of initial diagrams pulled to create each diagram. Diagrams could end up with fewer than N pts as the pts drawn below the diagonal will be discarded. See normalDiagram() for more information.
numDgms – The number of diagrams for the collection given as an integer.
muCenter – The means used for the normal distribution in normalDiagram() are drawn from the normal distribution with mean muCenter.
sd – The standard deviation for the normal distribution used for normalDiagram(), as well as for the standard deviation passed to normalDiagram().
permute – If
permute=True, the data frame returned has its rows randomly permuted. If False, the rows will be be sorted by the location of the means.seed – Used to fix the seed if passed an integer; otherwise should be None.
- Returns:
A pandas dataframe with columns
['Dgm', 'mean', 'sd', 'trainingLabel']. In this case, trainingLabel is the distance from the mean used for that persistence diagram to muCenter.
- teaspoon.MakeData.PointCloud.testSetRegressionLine(N=20, numDgms=40, muStart=(1, 3), muEnd=(2, 5), sd=1, permute=True, seed=None)[source]
Generate a collection of diagrams with means distributed along a line using the normalDiagram() function for regression tests.
- Parameters:
N – The number of initial points pulled to create each diagram. Diagrams could end up with fewer than N pts as the pts drawn below the diagonal will be discarded. See normalDiagram() for more information.
numDgms – The number of diagrams for the collection given as an integer.
muStart – The means used for the normal distribution in normalDiagram() are evenly spread along the line segment spanned by muStart and muEnd.
muEnd – The means used for the normal distribution in normalDiagram() are evenly spread along the line segment spanned by muStart and muEnd.
sd – The standard deviation for the normal distribution used for normalDiagram().
permute – If
permute=True, the data frame returned has its rows randomly permuted. If False, the rows will be be sorted by the location of the means.seed – Used to fix the seed if passed an integer; otherwise should be None.
- Returns:
A pandas dataframe with columns
['Dgm', 'mean', 'sd', 'trainingLabel']. In this case, trainingLabel is the distance from the mean used for that persistence diagram to muStart.
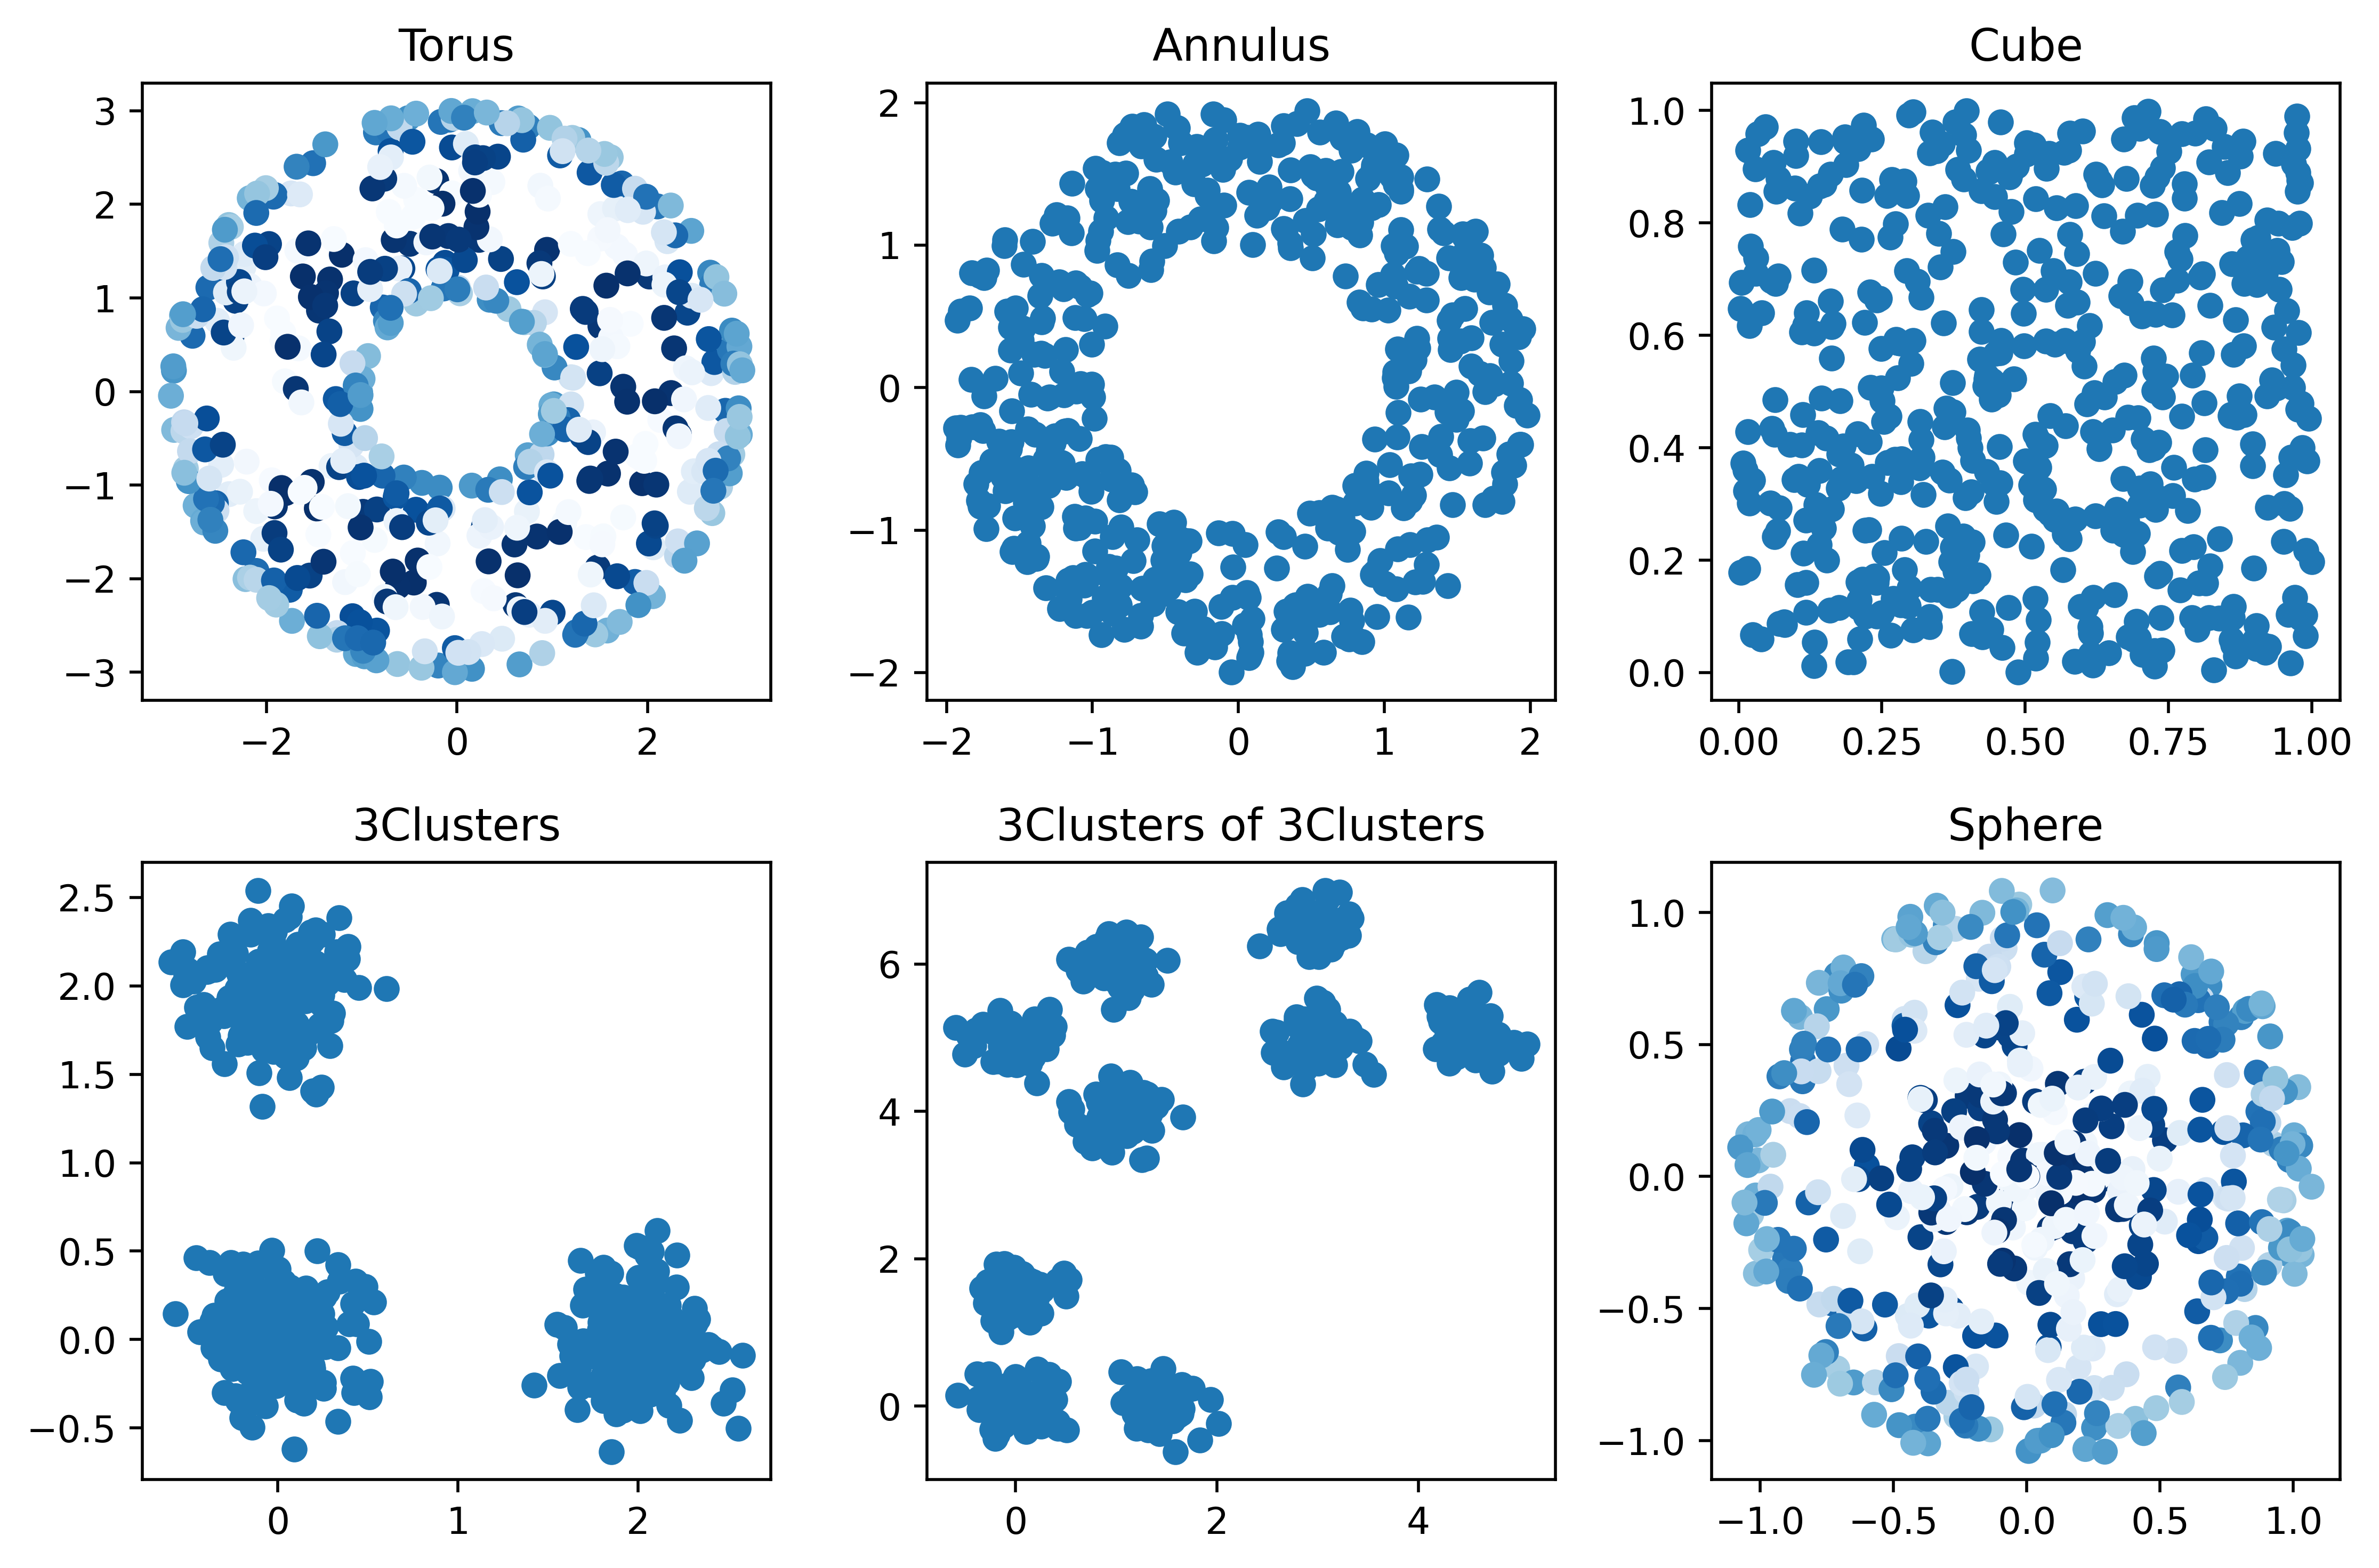
2.5.1.1. Examples
The following is an example generating point clouds sampled from different underlying shapes:
import numpy as np
import pandas as pd
import matplotlib.pyplot as plt

from teaspoon.MakeData.PointCloud import Torus, Annulus, Cube, Clusters, Sphere

numPts = 500
seed = 0

# Generate Torus
t = Torus(N=numPts,seed = seed)

# Generate Annulus
a = Annulus(N=numPts,seed = seed)

# Generate Sphere
s = Sphere(N = numPts, noise = .05,seed = seed)

# Generate Cube
c = Cube(N=numPts,seed = seed)

# Generate 3 clusters
cl = Clusters(centers=np.array( [ [0,0], [0,2], [2,0]  ]), N = numPts, seed = seed, sd = .05)

# Generate 3 clusters of 3 clusters
centers = np.array( [ [0,0], [0,1.5], [1.5,0]  ])
theta = np.pi/4
centersUp = np.dot(centers,np.array([(np.sin(theta),np.cos(theta)),(np.cos(theta),-np.sin(theta))])) + [0,5]
centersUpRight = centers + [3,5]
centers = np.concatenate( (centers,  centersUp, centersUpRight))
clcl = Clusters(centers=centers, N = numPts, sd = .05,seed = seed)

fig, axes = plt.subplots(2, 3, figsize=(9,6))

axes[0,0].scatter(t[:,0], t[:,1], c= t[:,2], cmap='Blues')
axes[0,0].set_title('Torus')

axes[0,1].scatter(a[:,0], a[:,1], cmap='Blues')
axes[0,1].set_title('Annulus')

axes[0,2].scatter(c[:,0], c[:,1], cmap='Blues')
axes[0,2].set_title('Cube')

axes[1,0].scatter(cl[:,0], cl[:,1], cmap='Blues')
axes[1,0].set_title('3Clusters')

axes[1,1].scatter(clcl[:,0], clcl[:,1], cmap='Blues')
axes[1,1].set_title('3Clusters of 3Clusters')

axes[1,2].scatter(s[:,0], s[:,1], c= s[:,2], cmap='Blues')
axes[1,2].set_title('Sphere')

plt.tight_layout()

plt.show()
Where the output for this example is:
The following is an example generating a data set of persistence diagrams computed from point clouds sampled from different underlying shapes. In this case, the persistence diagrams correspond to the point clouds shown in the above example:
from teaspoon.MakeData import PointCloud
import pandas as pd
import matplotlib.pyplot as plt

df = PointCloud.testSetManifolds(numDgms = 1, numPts = 500, seed=0)

fig, axes = plt.subplots(2,3,figsize=(9,6), sharex=True, sharey=True)
axes = axes.ravel()
for i in df.index:
  axes[i].scatter(df.loc[i,'Dgm0'][:,0], df.loc[i,'Dgm0'][:,1],label='$H_0$')
  axes[i].scatter(df.loc[i,'Dgm1'][:,0], df.loc[i,'Dgm1'][:,1],label='$H_1$')
  axes[i].plot([0,2], [0,2],c='k',linestyle='--')
  axes[i].set_title(df.loc[i,'trainingLabel'])
  axes[i].legend(loc=4)
plt.show()
Where the output for this example is:
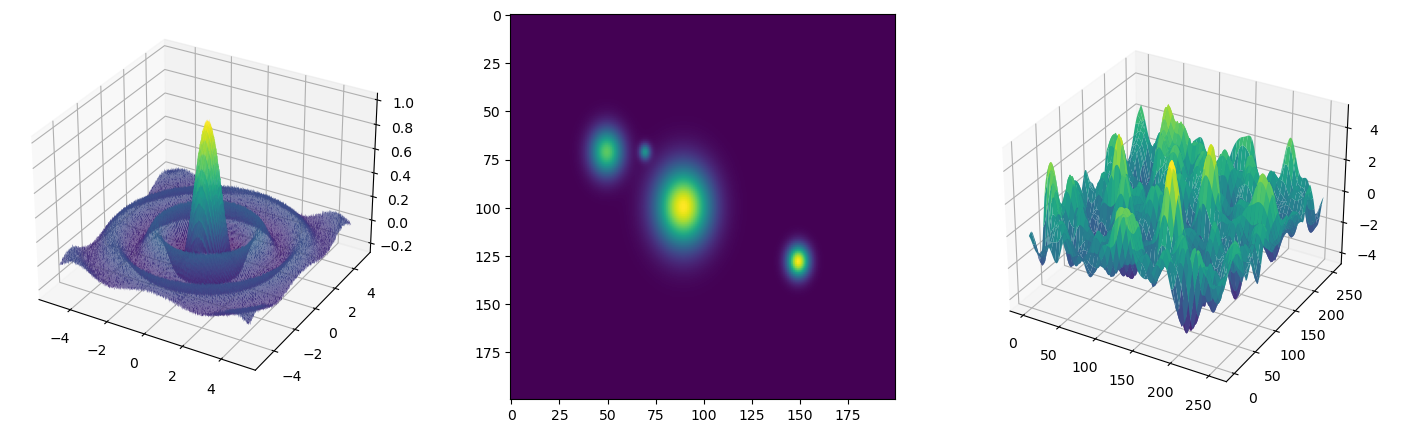
Finally, the following is an example of generating a sinc, gaussians, or a 2D gaussian field:
from teaspoon.MakeData.PointCloud import Sinc, Gaussians, GaussianField
import matplotlib.pyplot as plt

x1, x2, y1, y2 = -5, 5, -5, 5
N1, N2 = 1000, 500

f = Sinc(x1=x1, x2=x2, y1=y1, y2=y2, N1=N1, N2=N2, mu=0, sigma=0.01)

x, y = np.linspace(x1,x2,N1), np.linspace(y1,y2,N2)
X, Y = np.meshgrid(x, y)

fig = plt.figure(figsize=(20,20))
ax = fig.add_subplot(111, projection='3d')
ax.plot_surface(X, Y, f, rstride=5, cstride=5, cmap='viridis')
plt.show()

##
centers = np.array([[0, 0], [1, 1], [-1, 0], [4,2]])
variances = np.array([0.1, 0.5, 0.3, 0.2])
amplitudes= np.array([1, 2, 1.5, 2])

f = Gaussians(centers, variances, amplitudes)

plt.imshow(f)
plt.show()

##
field1 = GaussianField(256, 256, a=0.8, b=100)
tx = np.arange(0,256,1)
ty = np.arange(0,256,1)
x, y = np.meshgrid(tx[:-1],ty[:-1])
fig = plt.figure(figsize=(20,20))
ax = fig.add_subplot(111, projection='3d')
ax.plot_surface(x, y, field1, rstride=5, cstride=5, cmap='viridis')
plt.show()
Where the output for this example is: