2.1.1. Bifurcations using ZigZag (BuZZ)
This module contains code for the Bifurcations using ZigZag (BuZZ) method, which uses zigzag persistence to detect parameter values in a dynamical system which have a Hopf bifurcation. The paper summarizing this methodology is “Using Zigzag Persistent Homology to Detect Hopf Bifurcations in Dynamical Systems”. A basic example showing the functionality for some synthetic time series data can be found below.
- class sporktda.TDA.BuZZ.PtClouds(ptclouds, cplx_type='rips', num_landmarks=None, verbose=False)[source]
Class to hold collection of point clouds.
- Parameters:
ptclouds (list) – List of point clouds
cplx_type (string (not case sensitive)) – Type of complex you want to use. Options are Rips or Landmark (default is Rips)
num_landmarks (int) – Number of points to subsample (default is None, meaning no subsampling)
verbose (bool) – If true, prints updates when running code (default is False)
- plot_ZZ_Cplx(save=False, savename='Cplx.png', v_plts=None, h_plts=None)[source]
Plot the zigzag of rips complexes.
- Parameters:
save (bool) – Set to true if you want to save the figure (default is False)
savename (string) – Path to save figure (default is ‘Cplx.png’ in current directory)
v_plts (int) – Number of plots in vertical direction
h_plts (int) – Number of plots in horizontal direction
- plot_ZZ_Full_PtClouds(save=False, savename='PC_Full.png', v_plts=None, h_plts=None)[source]
Plot the zigzag of full point clouds. Only needed if using landmark complex and want to plot the full point clouds before subsampling.
- Parameters:
save (bool) – Set to true if you want to save the figure (default is False)
savename (string) – Path to save figure (default is ‘PC_Full.png’ in current directory)
v_plts (int) – Number of plots in vertical direction
h_plts (int) – Number of plots in horizontal direction
- plot_ZZ_PtClouds(save=False, savename='PC.png', v_plts=None, h_plts=None)[source]
Plot the zigzag of point clouds.
- Parameters:
save (bool) – Set to true if you want to save the figure (default is False)
savename (string) – Path to save figure (default is ‘PC.png’ in current directory)
v_plts (int) – Number of plots in vertical direction
h_plts (int) – Number of plots in horizontal direction
- run_Zigzag(r, k=2)[source]
Runs zigzag persistence on collections of point clouds, taking unions between each adjacent pair of point clouds. Adds attributes to class
zz,zz_dgms,zz_cellswhich are the outputs of dionysus’ zigzag persistence function. Also adds attributessetup_timeandzigzag_timewith timing data.- Parameters:
r (float or list of floats,) – Parameter for Rips complex on each point cloud. Can be a single number or a list with one value per point cloud.
k (int, optional) – Maximum dimension simplex desired (default is 2)
- setup_Zigzag_changing(r, k=2, verbose=False)[source]
Helper function for
run_Zigzagthat sets up inputs needed for Dionysus’ zigzag persistence function. This one allows r to be a list of radii, rather than one fixed value- Parameters:
r (list) – List of radii for rips complex of each X_i
k (int, optional) – Max dimension for rips complex (default is 2)
verbose (bool, optional) – If true, prints updates when running code
- Returns:
filtration (dio.Filtration) – Dionysis filtration containing all simplices that exist in zigzag sequence
times (list) – List of times, where times[i] is a list containing [a,b] where simplex i appears at time a, and disappears at time b
- setup_Zigzag_fixed(r, k=2, verbose=False)[source]
Helper function for
run_Zigzagthat sets up inputs needed for Dionysus’ zigzag persistence function. This only works for a fixed radius r.- Parameters:
r (float) – Radius for rips complex
k (int, optional) – Max dimension for rips complex (default is 2)
verbose (bool, optional) – If true, prints updates when running code
- Returns:
filtration (dio.Filtration) – Dionysis filtration containing all simplices that exist in zigzag sequence
times (list) – List of times, where times[i] is a list containing [a,b] where simplex i appears at time a, and disappears at time b
2.1.1.1. Example
First, import necessary modules, create some example data, and plot it:
import numpy as np
import matplotlib.pyplot as plt
from teaspoon.TDA.Draw import drawDgm
from sporktda.TDA.BuZZ import PtClouds
from teaspoon.SP.tsa_tools import takens
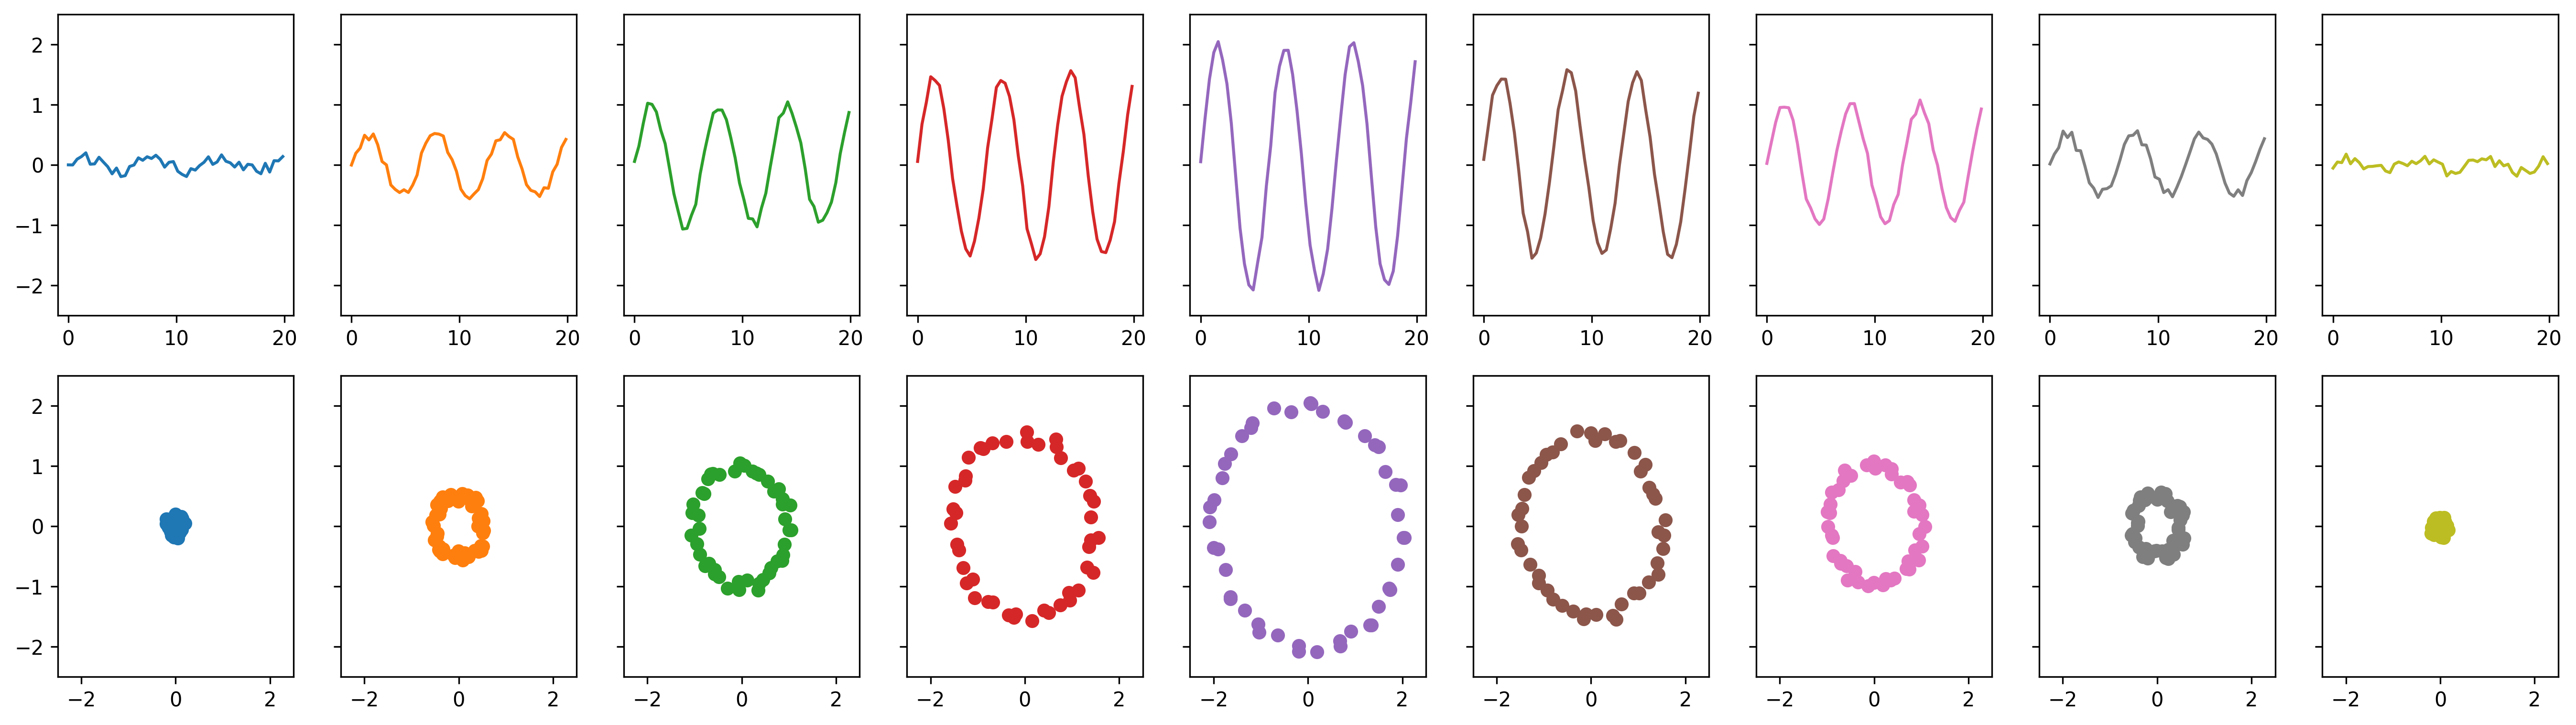
t = np.linspace(0, 6*np.pi+1, 50)
# Amplitudes of sine waves
amps = [0.1,0.5,1,1.5,2,1.5,1,0.5,0.1]
ts_list = []
ptcloud_list = []
for a in amps:
y = a*np.sin(t) + (0.1*np.random.randint(-100,100,len(t))/100)
# Compute sine wave and add noise uniformly distributed in [-0.1, 0.1]
ts_list.append(y)
# Compute time delay embedding point clouds
ptcloud_list.append(takens(y, n=2, tau=4))
Which produces the following figure:
Next, set up the zigzag with the point cloud data, and plot:
# Setup zigzag with point clouds
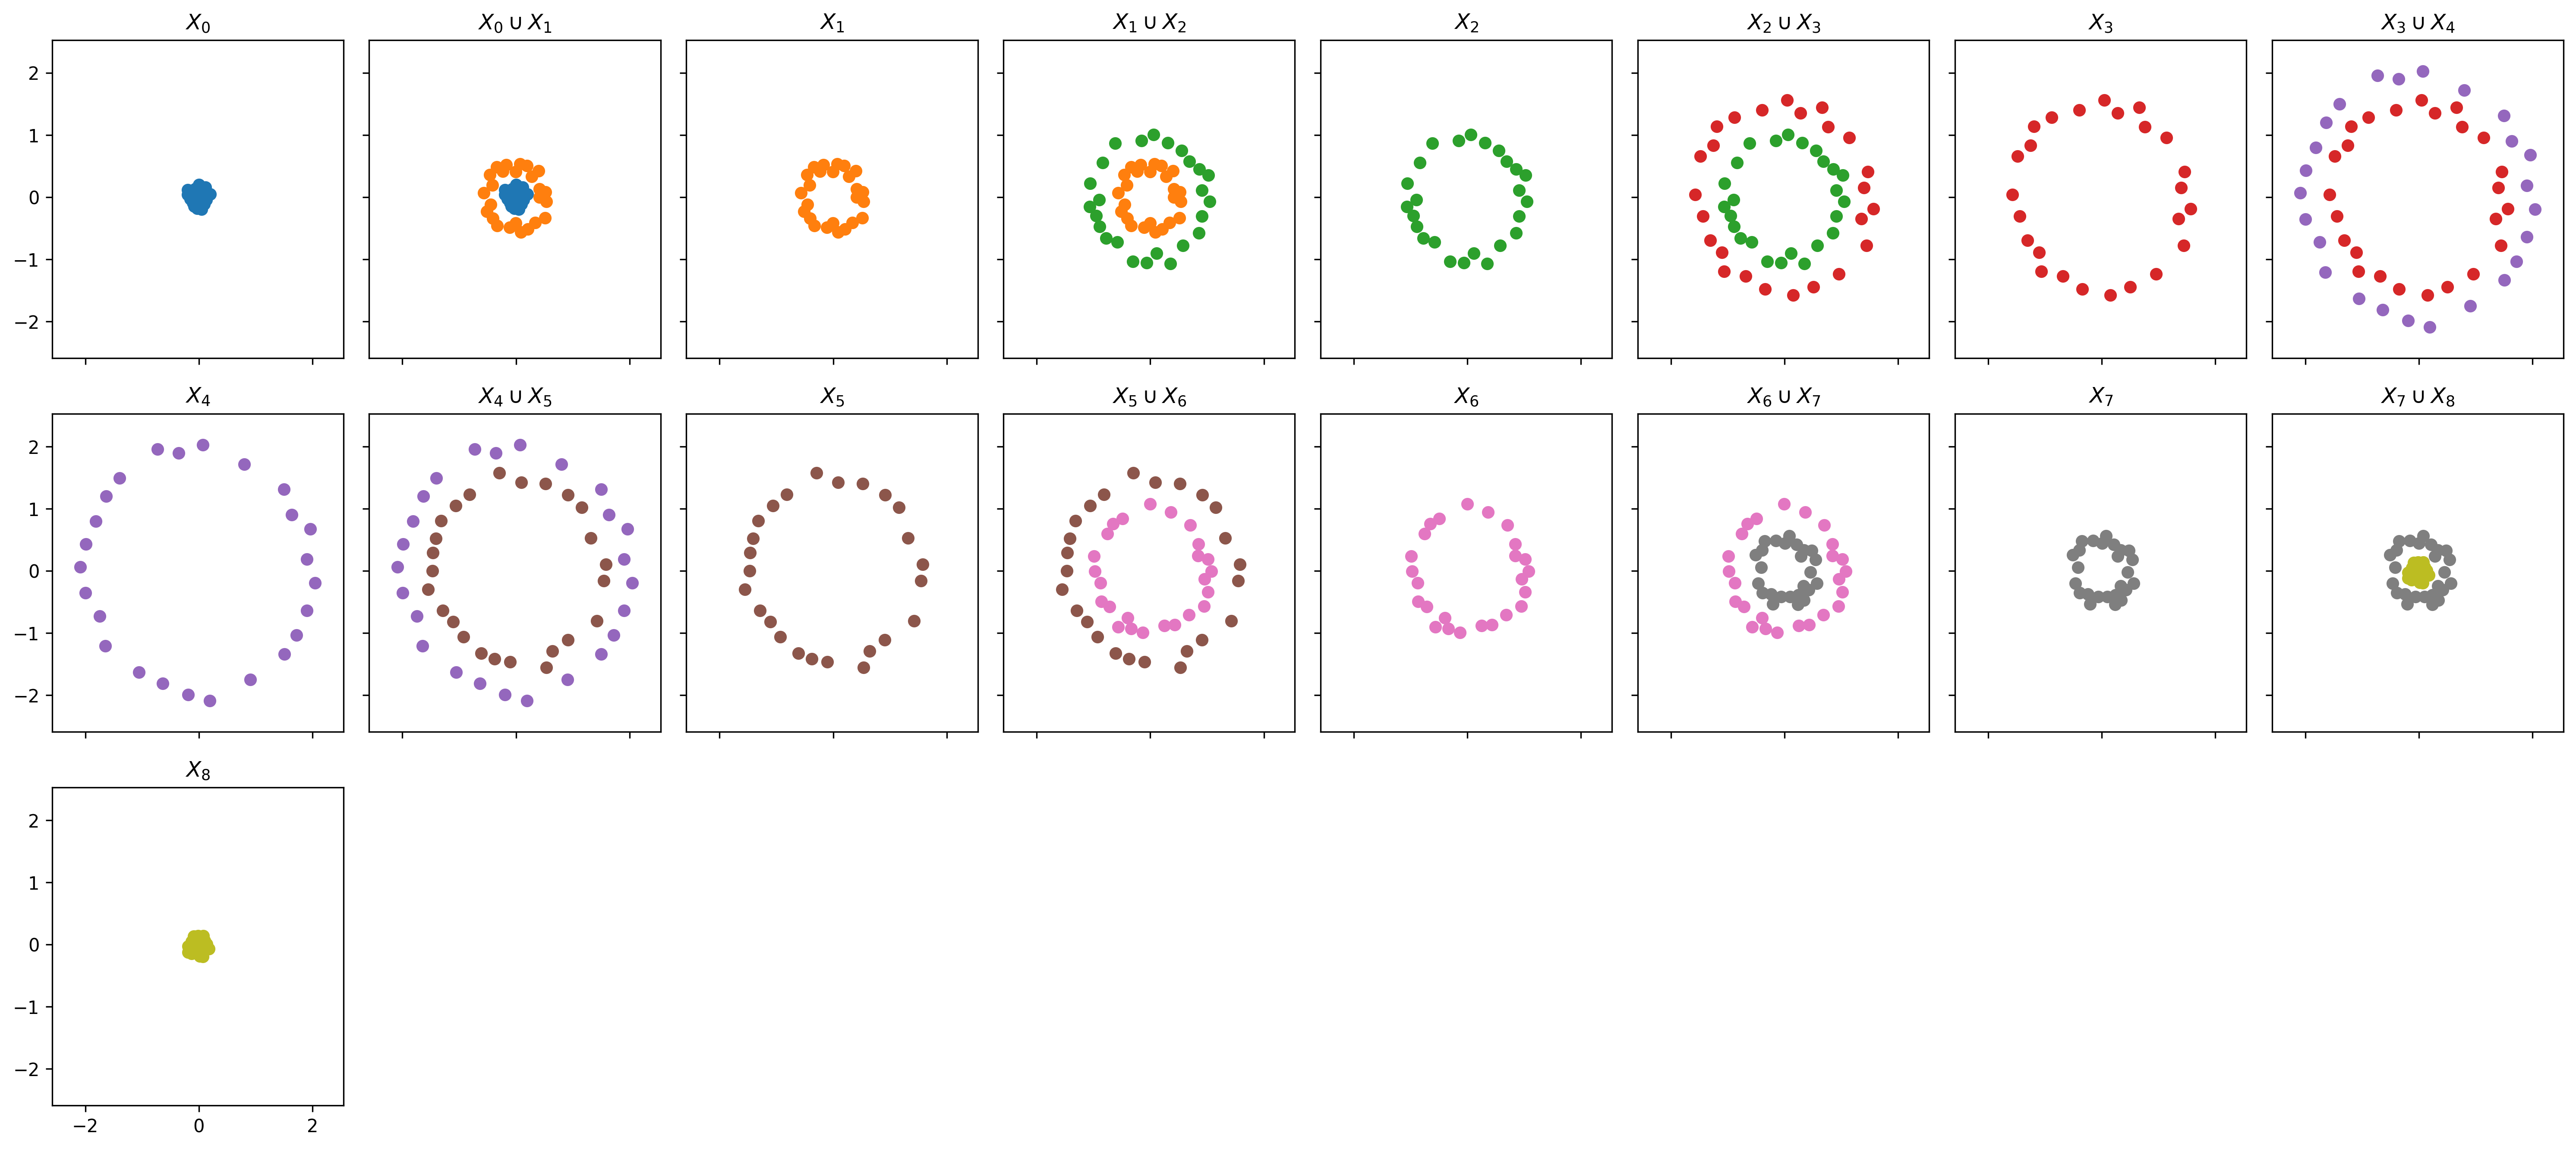
ZZ = PtClouds(ptcloud_list, num_landmarks=25, verbose=True)
# Plot zigzag of point clouds
ZZ.plot_ZZ_PtClouds()
Which produces the following figure:
Lastly, compute zigzag persistence, plot the zigzag of resulting Rips complexes and plot the persistence diagrams:
# Compute zigzag persistence
ZZ.run_Zigzag(r=0.85)
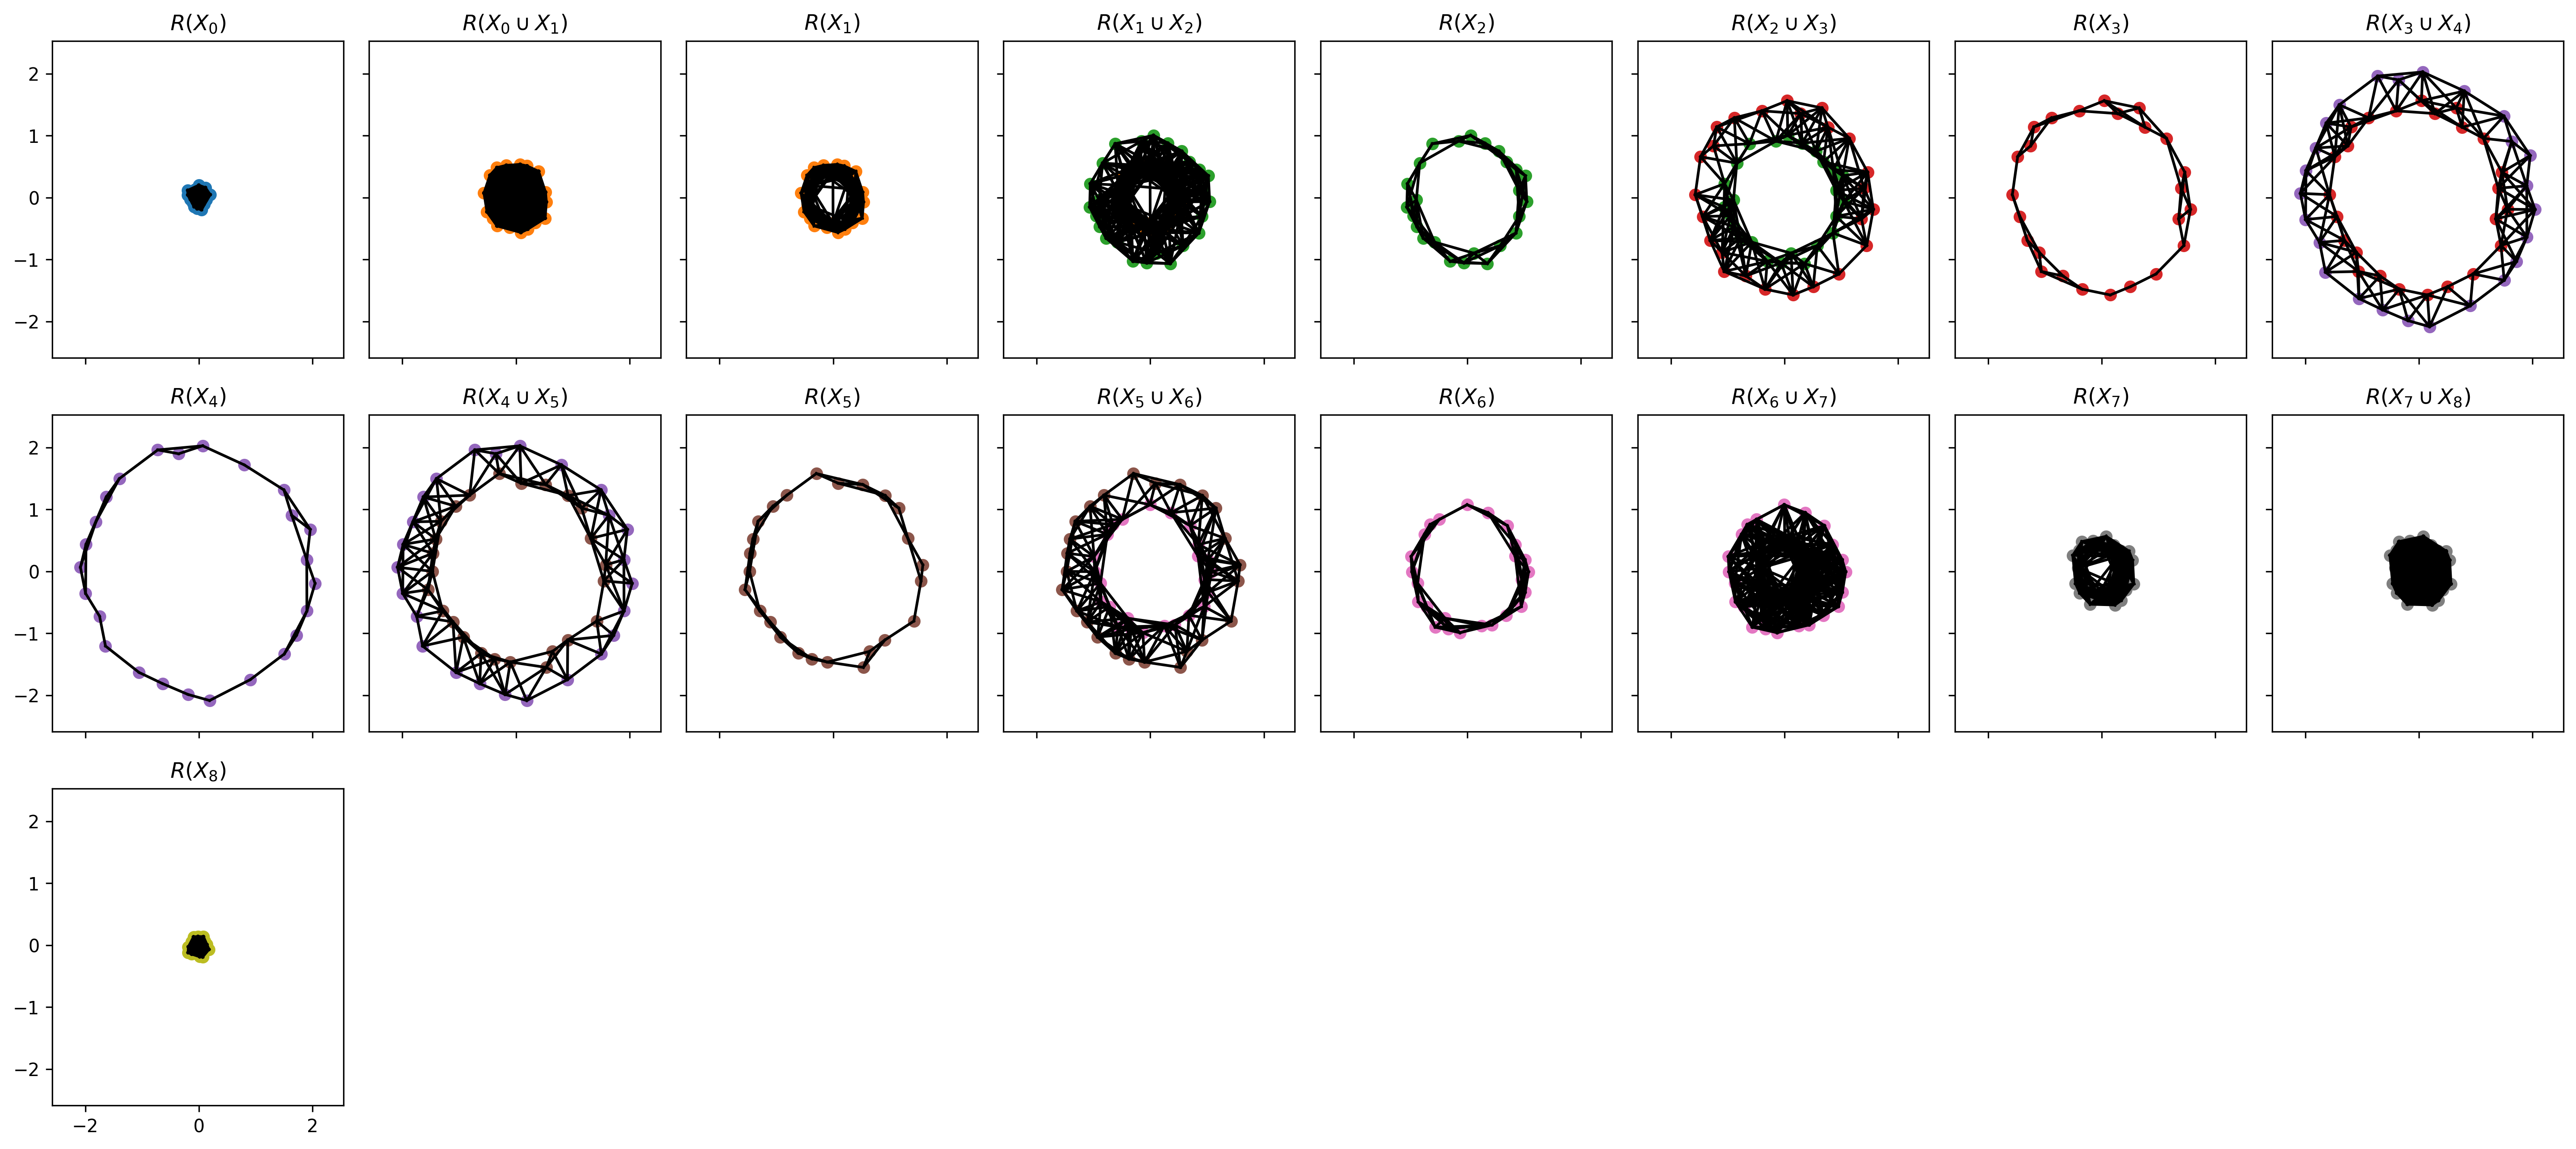
# Plot zigzag of Rips complexes
ZZ.plot_ZZ_Cplx()
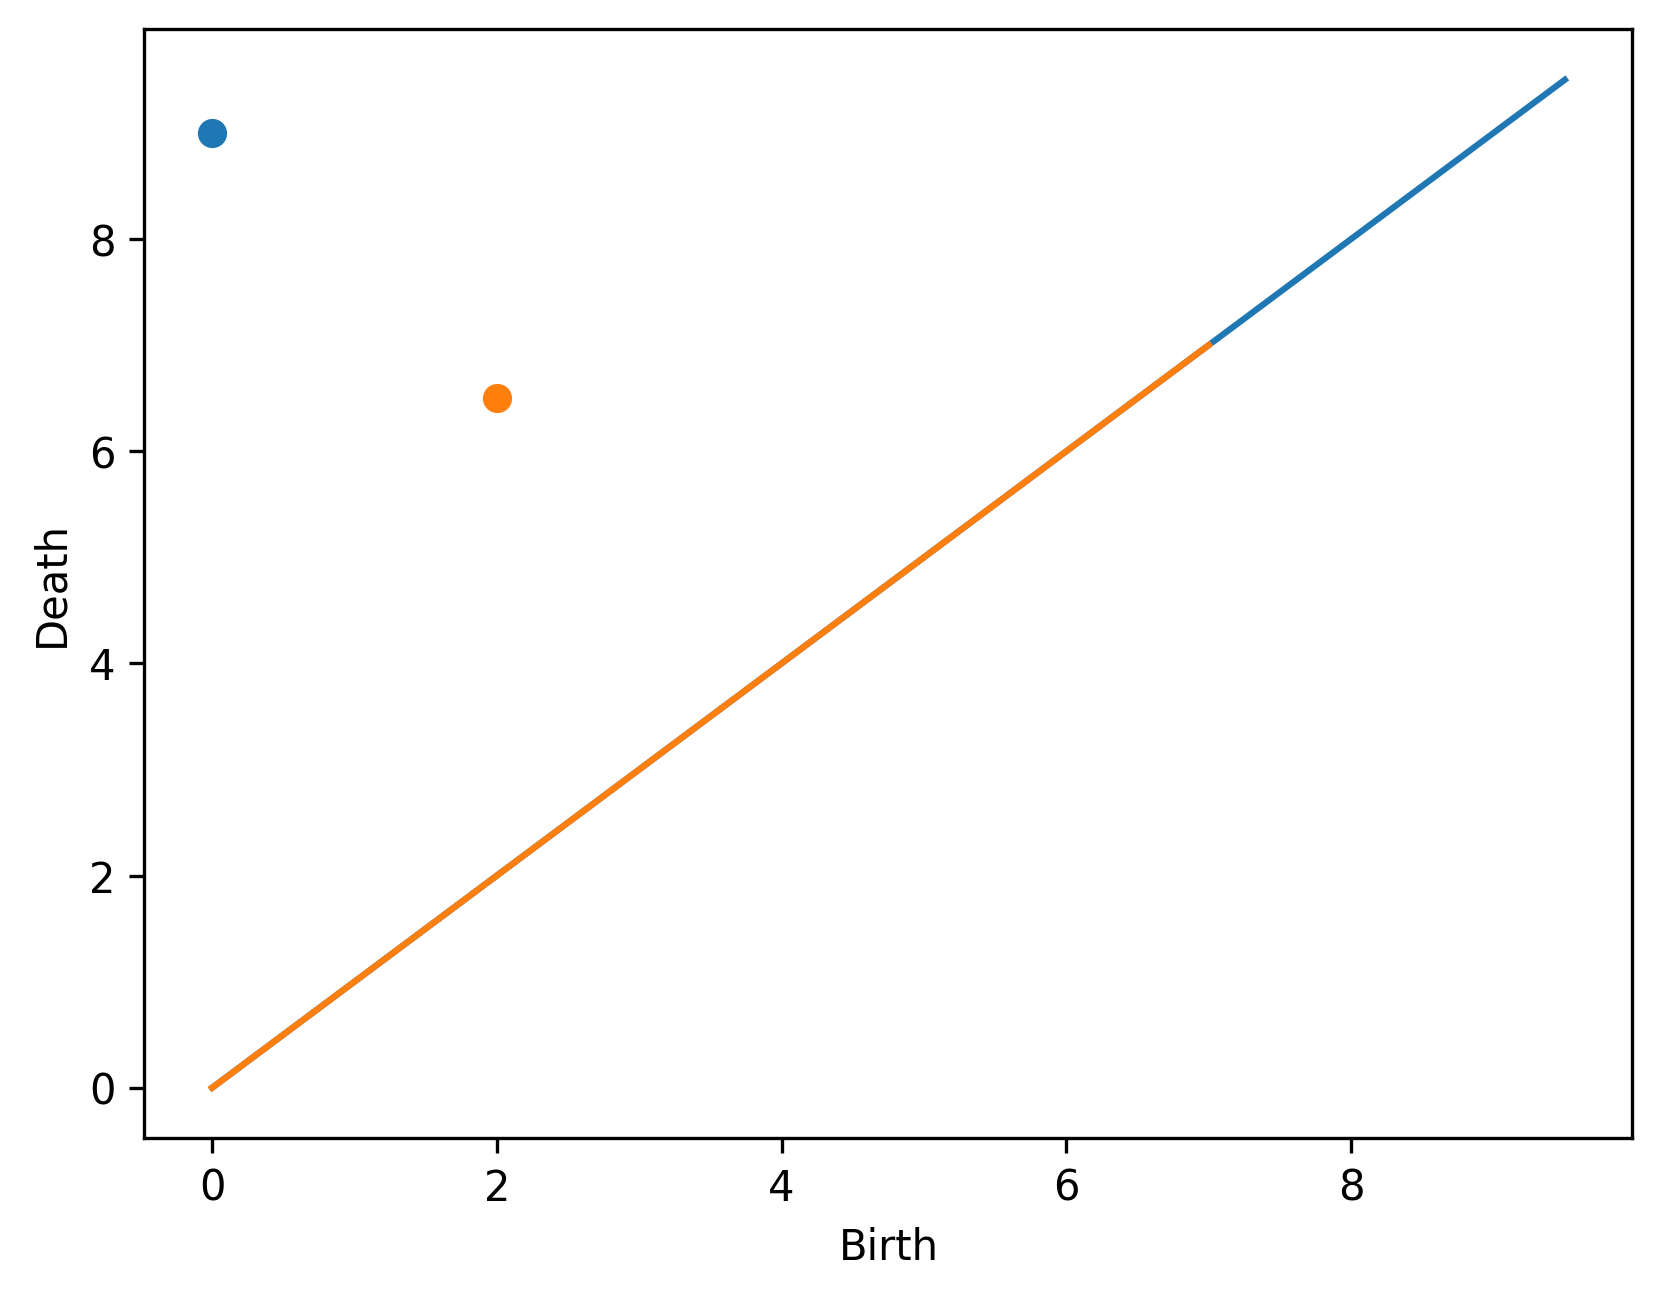
# Plot zigzag persistence diagram
drawDgm(ZZ.zz_dgms[0]) # 0-dimensional diagram
drawDgm(ZZ.zz_dgms[1]) # 1-dimensional diagram
Which produces the following figures: